HDFCBANK Options Analysis Dashboard
This dashboard provides an interactive analysis of Implied Volatility (IV) and Realized Volatility (RV) for HDFCBANK options. The data spans multiple time periods and includes various metrics for both call and put options.
Data Points
1,234
Avg IV (30d)
58.2%
Avg RV
23.7%
IV-RV Spread
34.5%
Time Series Analysis
IV vs RV Time Series
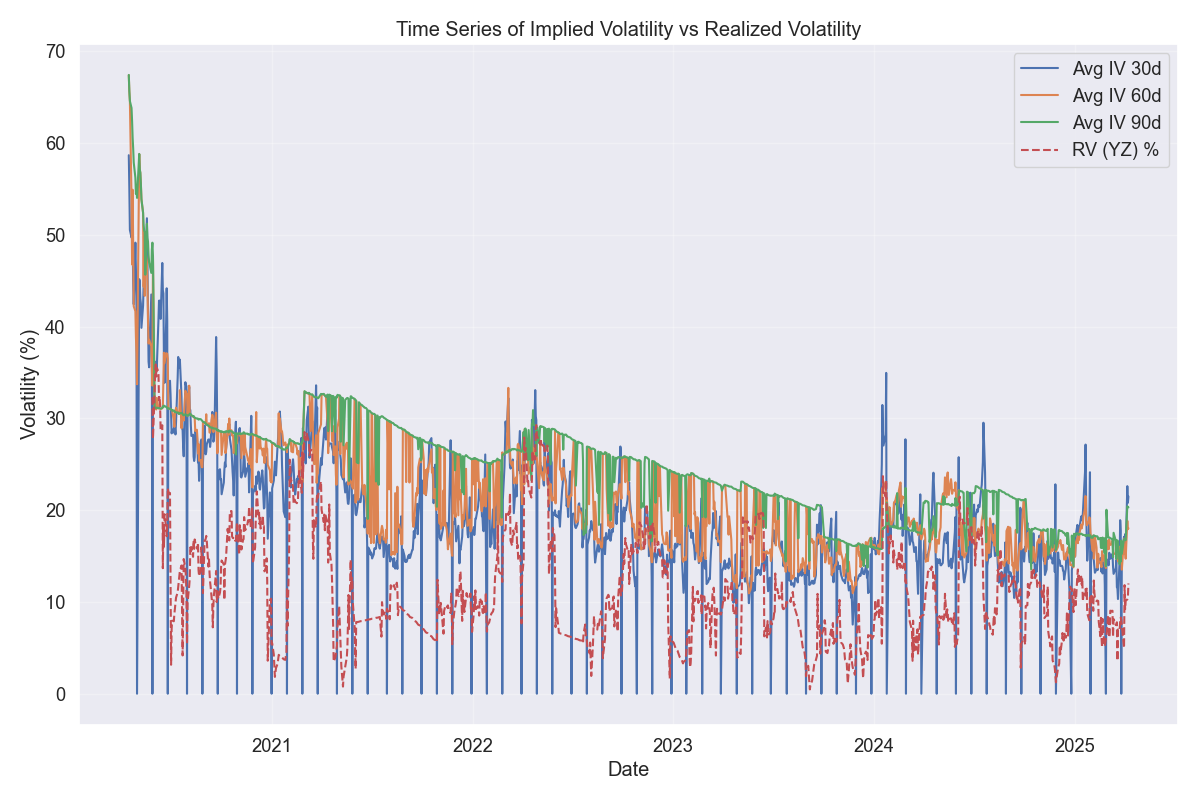
This chart shows the time series of Implied Volatility (IV) for different expiry periods (30d, 60d, 90d) compared to Realized Volatility (RV). The IV values are typically higher than RV, indicating a volatility risk premium.
Call Option IV Comparison
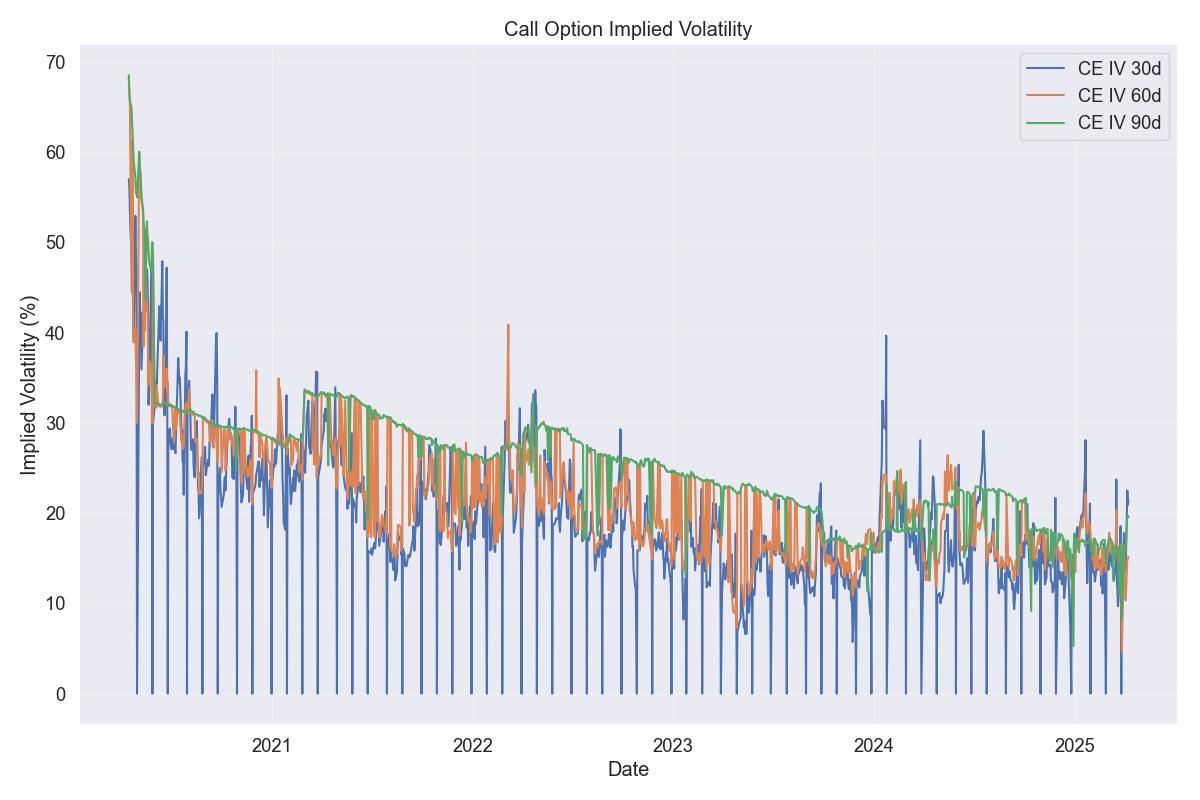
Comparison of Call Option Implied Volatility for different expiry periods (30d, 60d, 90d).
Put Option IV Comparison
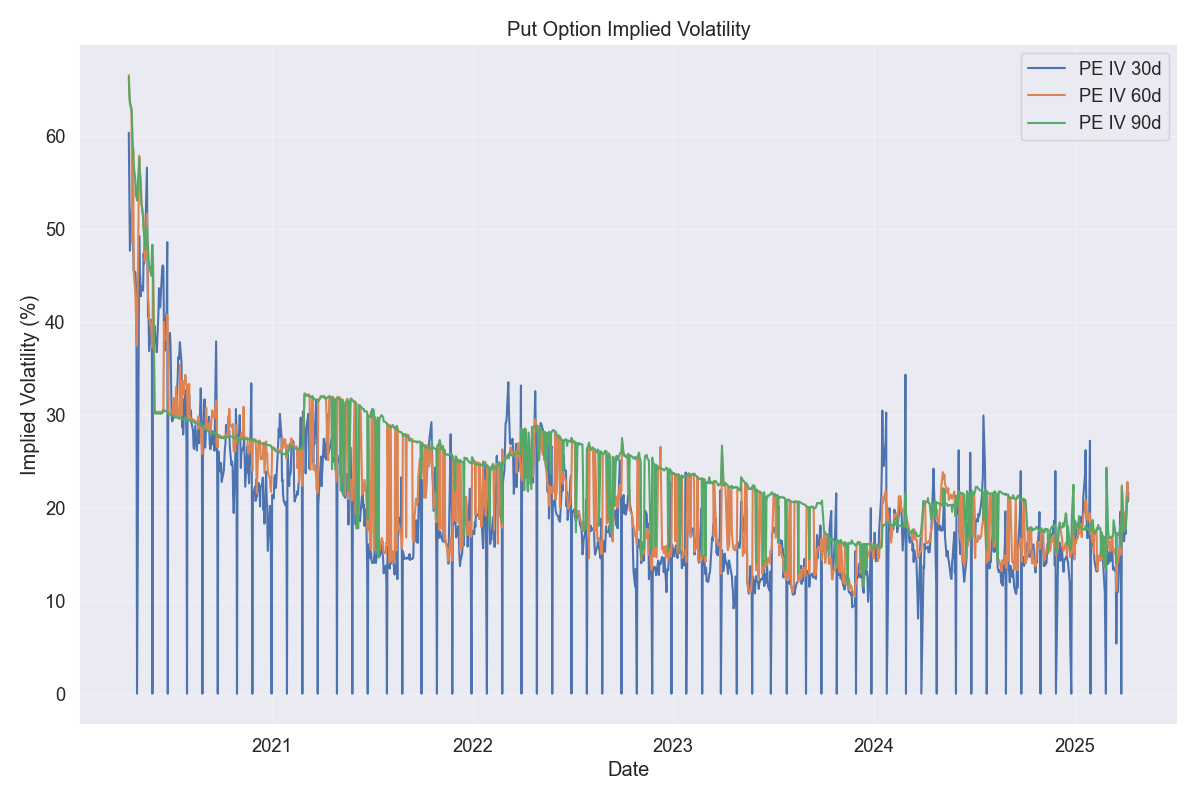
Comparison of Put Option Implied Volatility for different expiry periods (30d, 60d, 90d).
IV-RV Spread Over Time
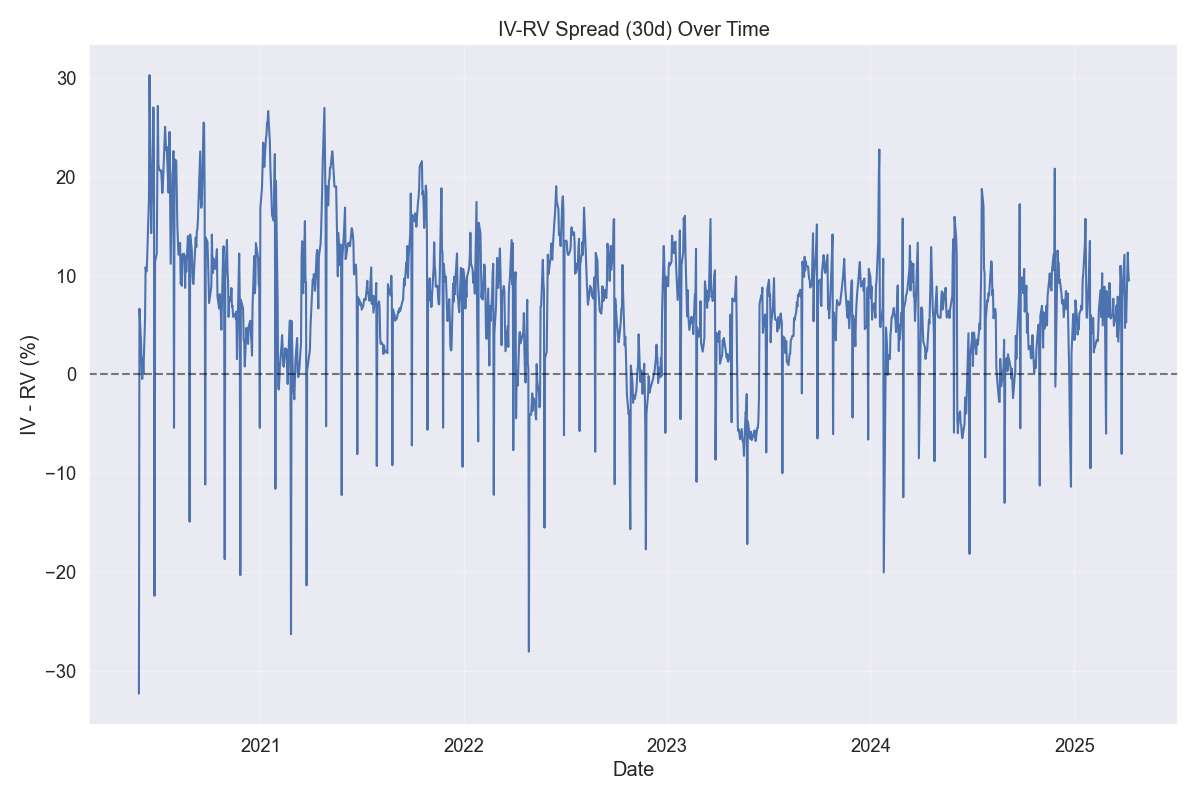
This chart shows the spread between Implied Volatility (30d) and Realized Volatility over time. Positive values indicate that IV is higher than RV, which is typically the case due to the volatility risk premium.
Term Structure Analysis
Call Option IV Term Structure
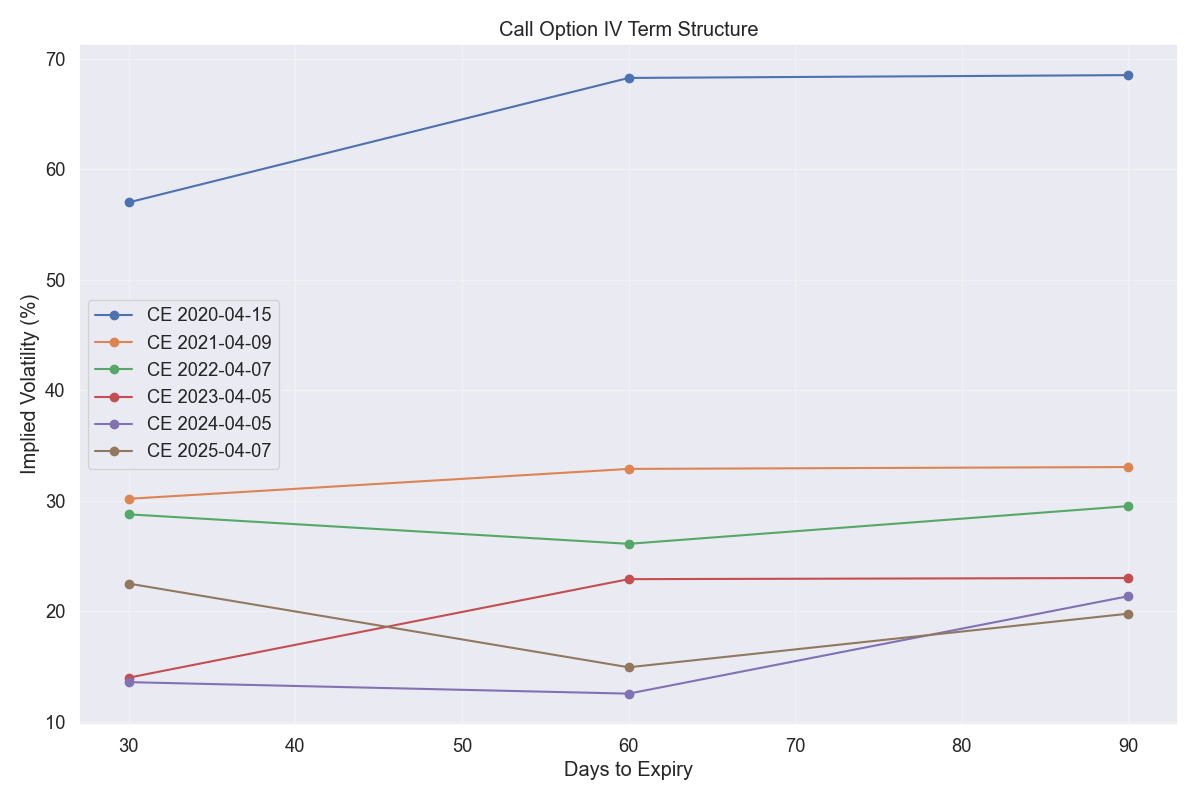
This chart shows the Call Option IV Term Structure on selected dates. The term structure typically slopes upward, with longer expiry options having higher IV.
Put Option IV Term Structure
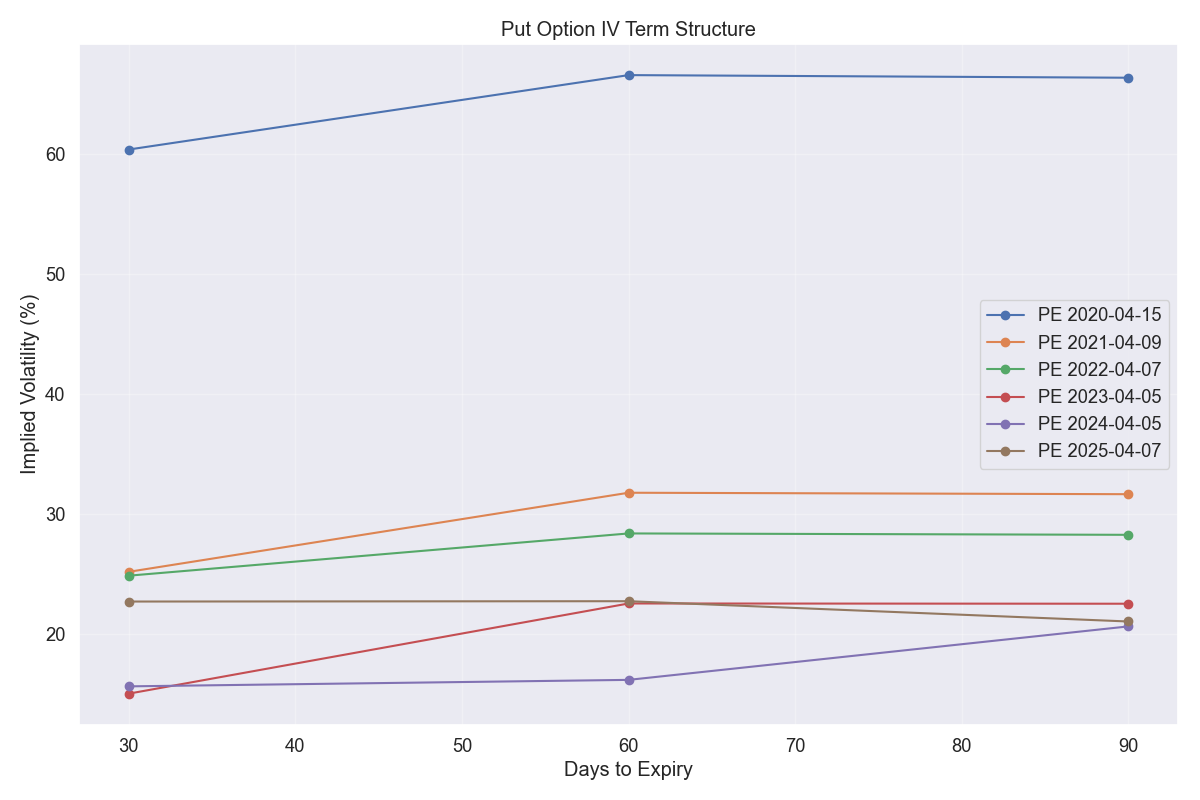
This chart shows the Put Option IV Term Structure on selected dates. The term structure typically slopes upward, with longer expiry options having higher IV.
Interactive Term Structure
This interactive chart allows you to select a specific date and view the IV term structure for both call and put options on that date.
Skew Analysis
IV Skew (CE - PE) for Different Expiry Periods
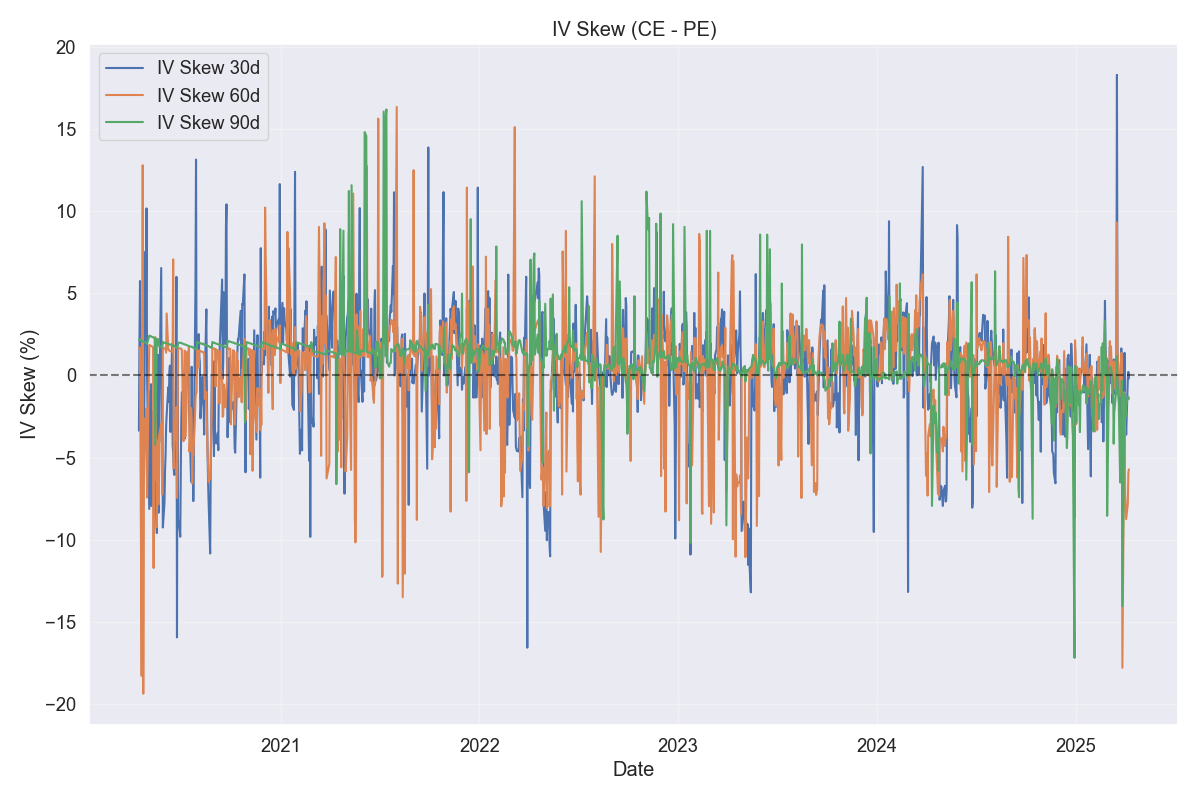
This chart shows the IV Skew (CE - PE) for different expiry periods (30d, 60d, 90d). Positive values indicate that call options have higher IV than put options, while negative values indicate the opposite.
IV vs Underlying Price
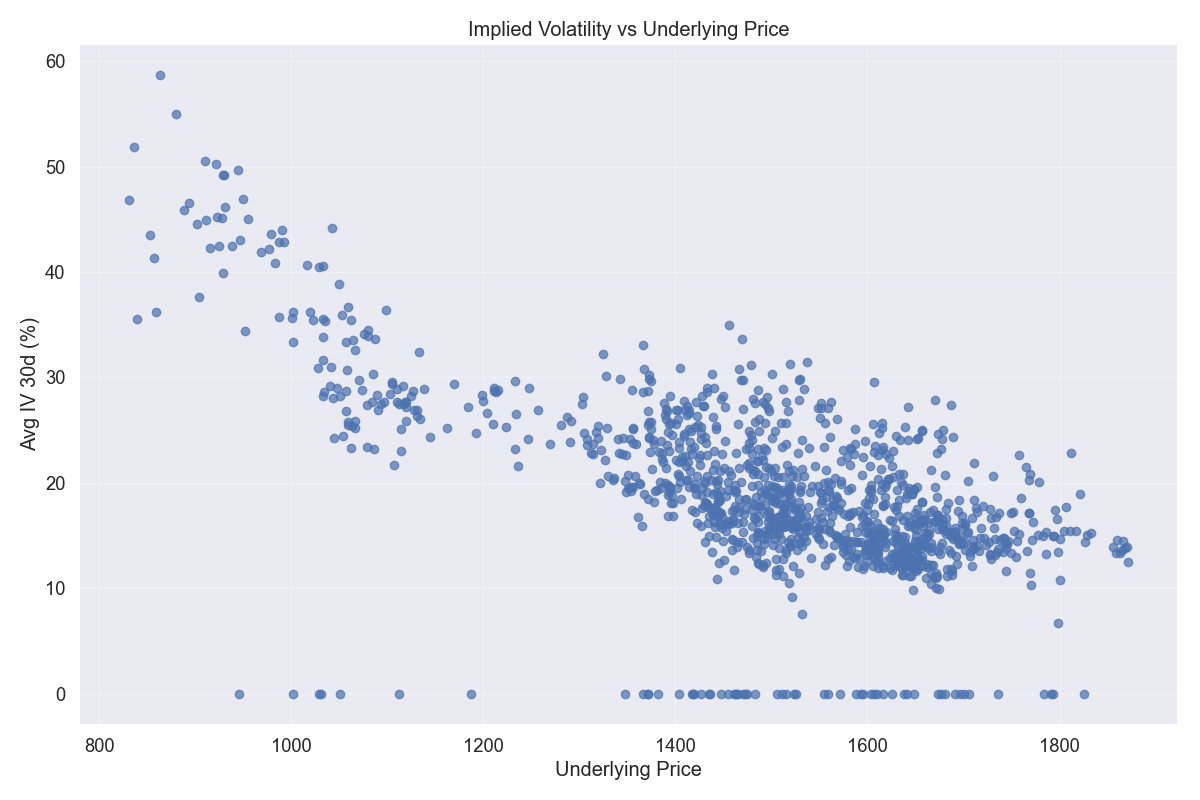
This scatter plot shows the relationship between Implied Volatility (30d) and the underlying price. There is often a negative correlation between IV and price, with IV increasing as price decreases.
IV vs RV Scatter Plot
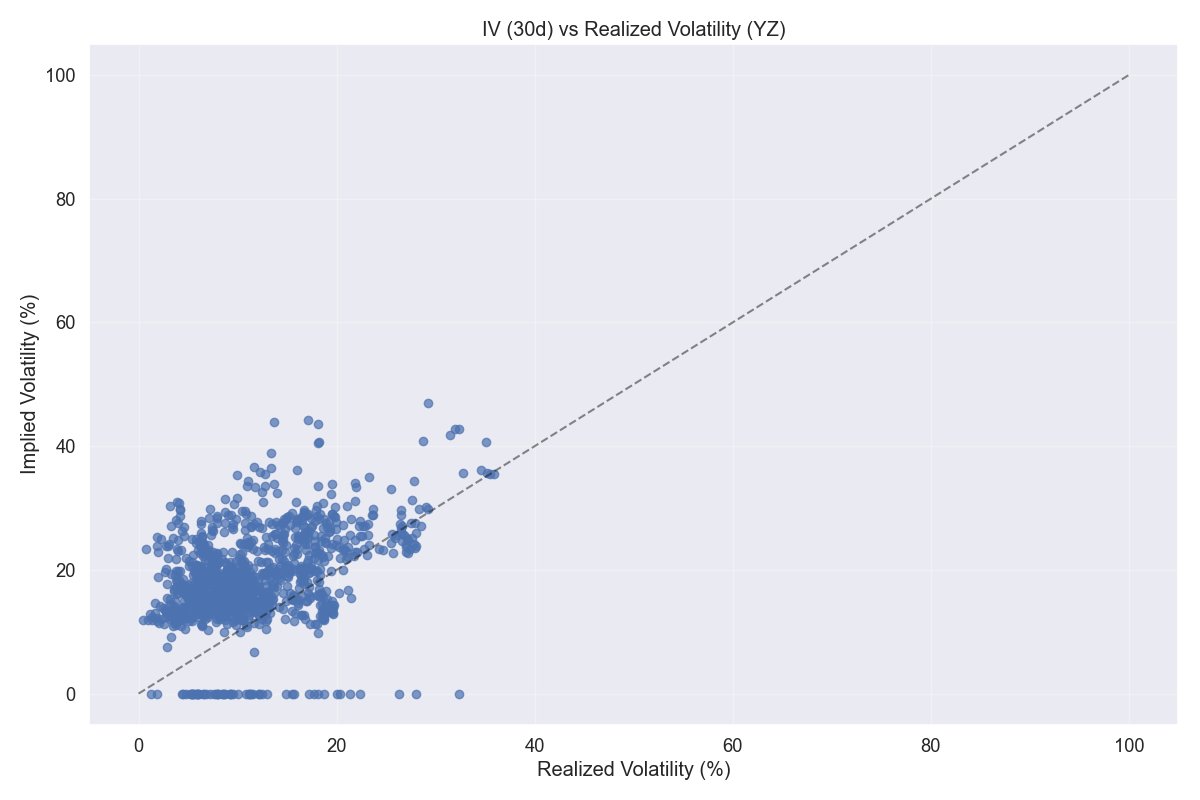
This scatter plot shows the relationship between Implied Volatility (30d) and Realized Volatility. Points above the 45-degree line indicate that IV is higher than RV, which is typically the case due to the volatility risk premium.
Distributions
IV 30d Percentile Distribution
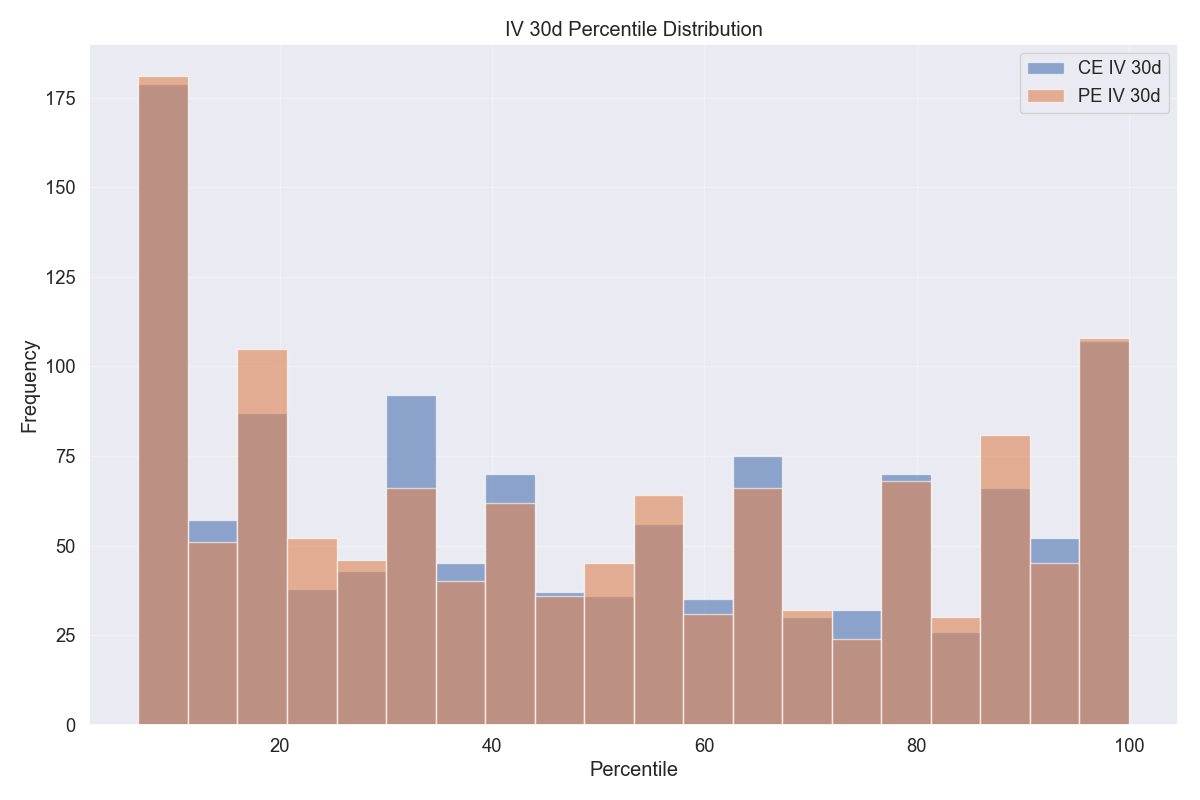
This histogram shows the distribution of IV 30d percentiles for both call and put options. The percentile indicates where the current IV stands relative to its historical range.
IV 30d Rank Distribution
This histogram shows the distribution of IV 30d ranks for both call and put options. The rank is similar to the percentile but is calculated differently.
Verification Results
IV Verification
| Check | Result |
|---|---|
| IV Range Check | PASS |
| IV Term Structure Check | FAIL |
| IV Variation Check | PASS |
RV Verification
| Check | Result |
|---|---|
| RV Range Check | PASS |
| RV Variation Check | PASS |
| RV Presence Check | PASS |
Verification Summary
The verification process checked the IV and RV calculations for validity and consistency. Most checks passed, with only the IV Term Structure Check showing anomalies.
The IV Term Structure Check failure indicates that in 379 out of 1234 instances (30.7%), the IV for shorter expiry options was higher than for longer expiry options. While this is not the typical pattern (longer expiry usually has higher IV), it can occur during periods of market stress or when there are specific events expected in the near term.
All RV checks passed, indicating that the Realized Volatility calculations are valid and consistent.